Code
library(spotifyr)
library(tidyverse)
library(knitr)
library(tidytext)
library(devtools)
library(wordcloud2)
library(textdata)
library(quanteda)
library(plotly)
library(kableExtra)
library(gridExtra)
The Grammy Awards, established in 1959 by the Recording Academy, celebrate artistic excellence across various music genres. Among its prestigious accolades, the “Song of the Year” award honors songwriters for their outstanding lyrical and compositional achievements, making it one of the most coveted titles in the industry. This project delves into the past winners of the “Song of the Year” award from 2000 to 2024, analyzing audio features and sentiment trends over time by year and gender. While this analysis provides a snapshot of previous winners, it does not encompass the entire history of the award. Additionally, the project examines the nominees for the 67th Grammy Awards, set to take place on February 2, 2025, to explore how these insights reflect broader trends in songwriting and music industry recognition.
The analysis hypothesizes that distinct trends in audio features and sentiment, such as danceability or energy, can be observed across past “Song of the Year” winners, varying by year and gender. By identifying these patterns, the project aims to predict which of this year’s nominees aligns most closely with the characteristics of previous winners.
The first part in investigating these songs was to make playlists in Spotify (as seen above) and bring them into R.Studio to get their audio features. Once all packages were downloaded, I gathered audio features using the package, spotifyr, and input my own data of their Year, Gender, and Duration in Minutes. In the code below, you will see that it is inputted as a comment. This is because while working on the analysis, the “Get Track’s Audio Features,” was removed for Spotify for Developers, no longer being accessible to the public. The data I collected for audio features can be found here: Winner Audio, Nominee Audio
library(spotifyr)
library(tidyverse)
library(knitr)
library(tidytext)
library(devtools)
library(wordcloud2)
library(textdata)
library(quanteda)
library(plotly)
library(kableExtra)
library(gridExtra)#Sys.setenv(SPOTIFY_CLIENT_ID = '9742fe52374a44dcbb1dfd95a763522a')
#Sys.setenv(SPOTIFY_CLIENT_SECRET = '09e4c9d317314111b7c7bac3c9f37506')
#access_token <- get_spotify_access_token()
#playlist_tracks <- get_playlist_tracks("7gDGeHipqi37phFqbtDjP7")
#track_info <- playlist_tracks |>
#select(track.id, track.name)
#track_ids <- playlist_tracks$track.id
# audio_features <- get_track_audio_features(track_ids)
#Winner_audio <- audio_features |>
#left_join(track_info, by = c("id" = "track.id")) |>
#mutate(year = c(2000, 2001, 2002, 2003, 2004, 2005, 2006, 2007, 2008,
# 2009, 2010, 2011, 2012, 2013, 2014, 2015, 2016, 2017,
# 2018, 2019, 2020, 2021, 2022, 2023, 2024)) |>
# mutate(gender = c('Collab', 'Male', 'Female', 'Female', 'Male', 'Male', 'Male', 'Female',
#'Female', 'Male', 'Female', 'Collab', 'Female', 'Collab', 'Female',
#'Male', 'Male', 'Female', 'Male', 'Male', 'Female', 'Female', 'Male',
# 'Female', 'Collab'))
#head(Winner_audio)
#playlist_tracks_2 <- get_playlist_tracks("1DU0h9DfFqMJSQ2NeLQ5Je")
#track_info_2 <- playlist_tracks_2 |>
#select(track.id, track.name)
#track_ids_2 <- playlist_tracks_2$track.id
# audio_features_2 <- get_track_audio_features(track_ids_2)
#Nom_audio <- audio_features_2 |>
#left_join(track_info_2, by = c("id" = "track.id"))
#head(Nom_audio)
#Winner_audio |>
# mutate(duration_minutes = round(duration_ms / 60000, 2)) -> Winner_audio
#Nom_audio |>
#mutate(duration_minutes = round(duration_ms / 60000, 2)) |>
# mutate(gender = c('Female', 'Female', 'Female', 'Male', 'Collab', 'Female',
# 'Male', 'Collab')) -> Nom_audio
library(readr)
Nom_audio <- read_csv("Nom_audio.csv")
library(readr)
Winner_audio <- read_csv("Winner_audio.csv")To examine audio features, I input my data into Tableau. Here, we could take a closer look at the comparison between the years and data.
Acousticness - Confidence measure of whether track is acoustic.
Danceability - Describes how suitable a track is for dancing.
Energy - Measures a perceptual measure of intensity and activity.
Instrumentalness - Predicts whether a track contains no vocals.
Liveness - Detects presence of an audience in the recording.
Loudness - Overall loudness of track in decibels (dB).
Speechiness - Presence of spoken words in a track.
Valence - Describes musical positiveness conveyed by a track.
The audio features can be further explained here.
The first visualization lays out the nominees for Song of the Year and breaks it down by audio feature. The reference line in each feature represents the average from the years 2000 to 2024.
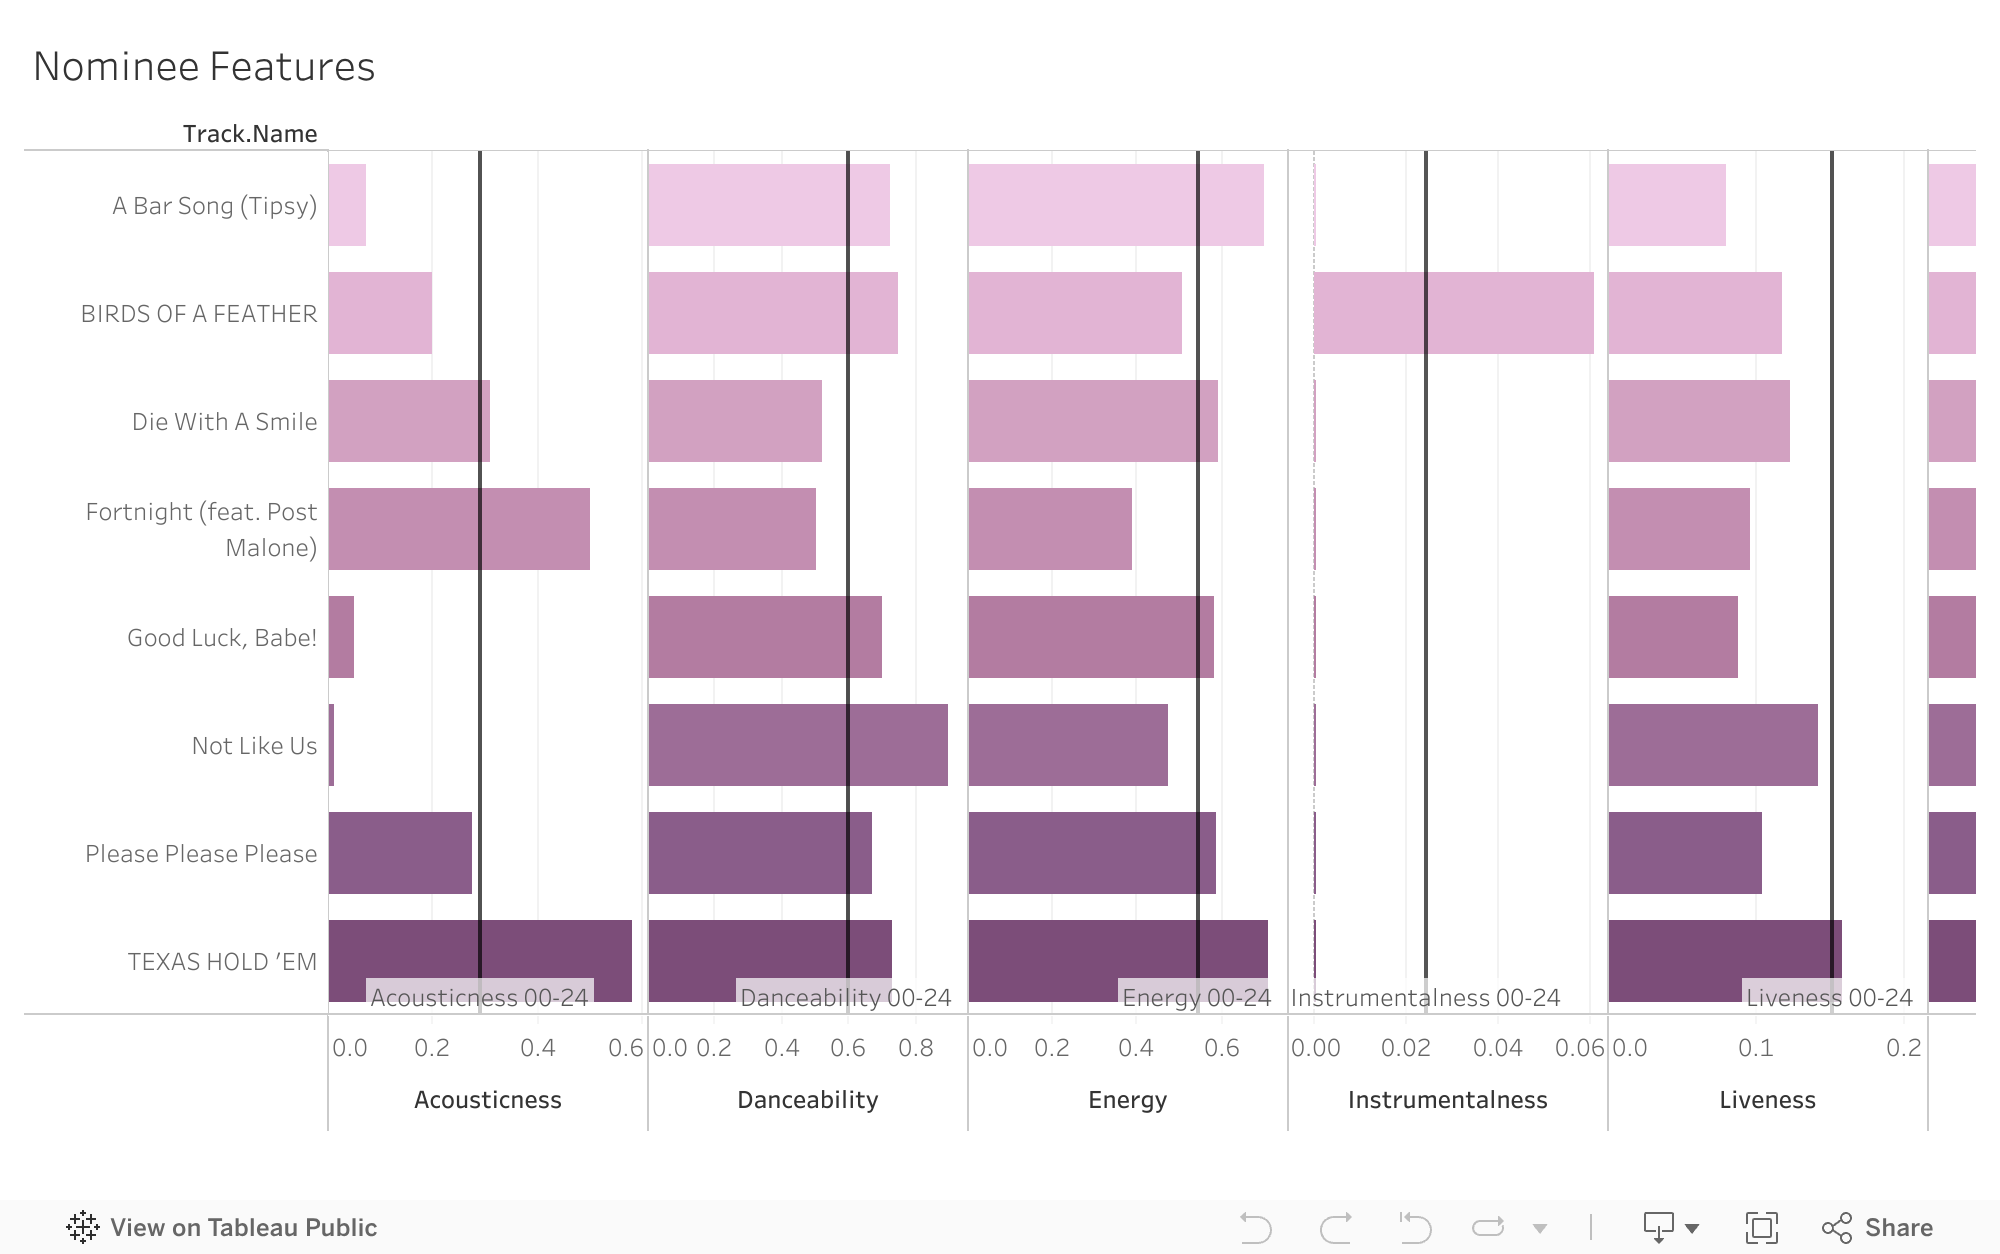
This shows how in some categories, the average aligns with the songs for this year, however, Instrumentalness, Speechiness, and Valence, the reference from the past 25 years is higher than the features for most songs of 2025.
The graph above shows the averages and how the nominees compare, but there is no one song that clearly hits all the marks. To further investigate the trends, we can look at features that may seem as though they have a connection, and would have a linear increase between the two traits.

These two visualizations show how over the past 25 years of winners, there has been a wide variety of high and low energy songs, as well as speechy-er and more danceable songs. The graph on the right is interesting because the square closer to the top left is shown to be a less danceable song with a higher speechiness rate. The song is “Single Ladies,” which feels as a much dancier song than some others. When looking at the opposite end on this graph, the green + shows a song with low speechiness and much higher danceability. “Not Like Us” is a much more rap-y song which would feel to have a higher speechiness than what is appearing.
Listen to these songs here…
Another way we can see if there is any correlation, or reasoning behind the lack of correlation is if there is change over years that contribute to this.
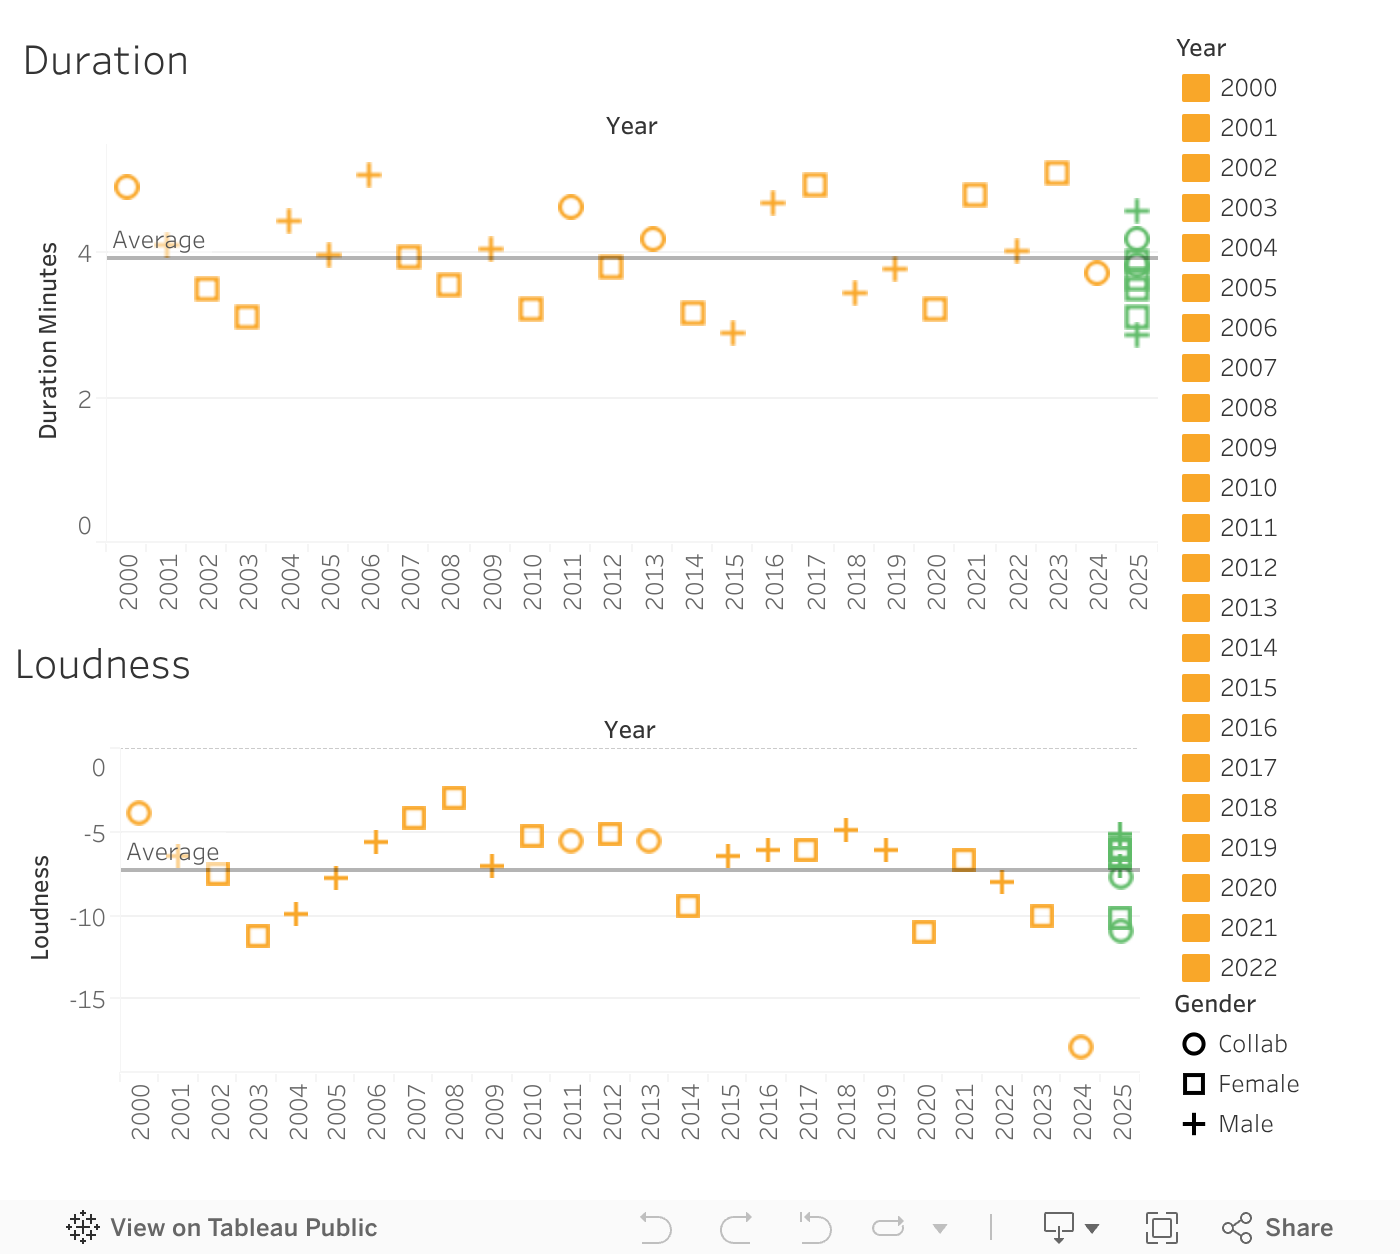
When looking throughout the years, there still appears to be no consistent correlations, however with these traits there is a bit more of a connection. Looking at loudness, it is interesting to see how they are all between -2.97 and -11.22, except for the outlier, “What Was I Made For?” at -17.84. Listen to “What Was I Made For?” below and compare it to the ‘loudest’ song, “Rehab.”
Another way to analyze the similarities and differences between the songs could be to further explore the words.
library(readr)
Grammy_Song_of_the_Year <- read_csv("Grammy Song of the Year.csv")

Grammy_Song_of_the_Year |>
  unnest_tokens(word, Lyrics) -> Grammy_words

Grammy_words |>
  filter(!word %in% c('na', 'chorus', 'verse', 'bridge', 'outro', 'pre', 'yeah','la','woo',
                      'ooh', 'dat', 'uh', 'aaa', 'yo', '1', '2', '3',
                      'ayy', 'wop', 'em', 'ya', 'za')) |>
  anti_join(stop_words, by = "word") |>
  count(word, Title, Gender, Year, sort = TRUE) |>
  arrange(desc(n)) -> Grammy_filtered

Grammy_filtered |>
  count(word, sort = TRUE) |>
  head(180) |>
  arrange(desc(n)) -> Grammy_top

as.data.frame(Grammy_top) -> Grammy_top
wordcloud2(Grammy_top, shape = "circle")
To make the word cloud I tokenized the lyrics, filtered out common stop words, as well as words related to parts of the songs, numbers, and more musical words, then counted word frequencies.
Used Datasets: Grammy Song of the Year, Grammy Filtered, Grammy Top
To gather more about the sentiment we can look at the words that are below and above 0 to see if there are any themes between the groups of artists. To do this, I used ‘afinn’ to get the sentiment and filtered to a certain gender, value range, and used the top 10 words in each, creating Grammy Sentiment data.
Grammy_filtered |>
  arrange(Title) |>
  inner_join(get_sentiments('afinn')) -> Grammy_sentiment

table1 <- Grammy_sentiment |>
  filter(Gender %in% "Female") |>
  filter(value < 0) |>
  head(10) |>
  count(word, value, sort = TRUE) |>
  knitr::kable(caption = "Female Negative")

table2 <- Grammy_sentiment |>
  filter(Gender %in% "Male") |>
  filter(value < 0) |>
  head(10) |>
  count(word, value, sort = TRUE) |>
  knitr::kable(caption = "Male Negative")

table3 <- Grammy_sentiment |>
  filter(Gender %in% "Collab") |>
  filter(value < 0) |>
  head(10) |>
  count(word, value, sort = TRUE) |>
  knitr::kable(caption = "Collab Negative")

table1
table2
table3| word | value | n |
|---|---|---|
| bad | -3 | 1 |
| bloody | -3 | 1 |
| criminal | -3 | 1 |
| cynical | -2 | 1 |
| dead | -3 | 1 |
| die | -3 | 1 |
| mad | -3 | 1 |
| pity | -2 | 1 |
| sad | -2 | 1 |
| scared | -2 | 1 |
| word | value | n |
|---|---|---|
| broken | -1 | 1 |
| drunk | -2 | 1 |
| forget | -1 | 1 |
| hard | -1 | 1 |
| hell | -4 | 1 |
| hopeless | -2 | 1 |
| messed | -2 | 1 |
| miss | -2 | 1 |
| shit | -4 | 1 |
| worry | -3 | 1 |
| word | value | n |
|---|---|---|
| crash | -2 | 1 |
| die | -3 | 1 |
| drunk | -2 | 1 |
| forget | -1 | 1 |
| ghost | -1 | 1 |
| hard | -1 | 1 |
| lost | -3 | 1 |
| scream | -2 | 1 |
| swear | -2 | 1 |
| war | -2 | 1 |
The word lists in the Female Negative, Male Negative, and Collab Negative categories reveal how negativity is expressed differently in song lyrics. Female Negative words like sad, mad, and scared suggest emotional vulnerability and internal struggles, reflecting feelings of helplessness or distress. In contrast, Male Negative words such as hell, hopeless, and shit are more intense and outwardly directed, often expressing frustration or aggression. The Collab Negative list combines both personal turmoil and external conflict, with words like drunk, lost, war, and crash, showing a blend of internal emotions and larger, dramatic struggles. Together, these lists illustrate how language in song lyrics conveys varying forms of negative sentiment, shaped by gender.
Grammy_sentiment |>
  filter(Gender %in% "Female") |>
  filter(value > 0) |>
  head(10) |>
  count(word, value, sort = TRUE) |>
  knitr::kable(caption = "Female Positive")
Grammy_sentiment |>
  filter(Gender %in% "Male") |>
  filter(value > 0) |>
  head(10) |>
  count(word, value, sort = TRUE) |>
  knitr::kable(caption = "Male Positive")
Grammy_sentiment |>
  filter(Gender %in% "Collab") |>
  filter(value > 0) |>
  head(10) |>
  count(word, value, sort = TRUE) |>
knitr::kable(caption = "Collab Positive")| word | value | n |
|---|---|---|
| love | 3 | 2 |
| fun | 4 | 1 |
| glad | 3 | 1 |
| likes | 2 | 1 |
| loved | 3 | 1 |
| luck | 3 | 1 |
| pleasure | 3 | 1 |
| pretty | 1 | 1 |
| save | 2 | 1 |
| word | value | n |
|---|---|---|
| love | 3 | 2 |
| beautiful | 3 | 1 |
| care | 2 | 1 |
| grace | 1 | 1 |
| loved | 3 | 1 |
| luck | 3 | 1 |
| pray | 1 | 1 |
| reach | 1 | 1 |
| true | 2 | 1 |
| word | value | n |
|---|---|---|
| love | 3 | 2 |
| alive | 1 | 1 |
| dream | 1 | 1 |
| perfect | 3 | 1 |
| promised | 1 | 1 |
| smile | 2 | 1 |
| survived | 2 | 1 |
| wishing | 1 | 1 |
| worth | 2 | 1 |
The word lists in the Female Positive, Male Positive, and Collab Positive categories reveal how positivity is expressed in song lyrics across different contexts. The Female Positive list features words like love, fun, glad, and pretty, which evoke feelings of joy, pleasure, and affection, often highlighting emotional connections or personal happiness. Male Positive words such as love, beautiful, grace, and care also emphasize positive emotional experiences, but with a slightly more reflective or careful tone, as seen in words like pray and grace. The Collab Positive list combines words like alive, dream, perfect, and survived, which suggest a sense of hope, resilience, and fulfillment. Together, these lists show how positive language in song lyrics reflects varying expressions of love, happiness, and hope, shaped by gender themes.
Overall, song lyrics use language to convey emotion in ways influenced by gender. Negative words in female, male, and collaborative songs highlight different forms of struggle, from vulnerability to outward frustration and complex conflicts. Positive words reveal universal themes of love and joy, with nuances in tone that reflect personal happiness, resilience, or hope, shaped by gendered perspectives.
To look further into the words, we can analyze the past songs to see if there are similarities of themes and sentiment throughout. These show the Word Value by Gender of Artist and the Sentiment Value Timeline, which also shows, on the hover, the words that make up that average value, and a reference line of the gender average. Also shown are the nominees for the 2025 Grammys and how they compare to the average for Gender.

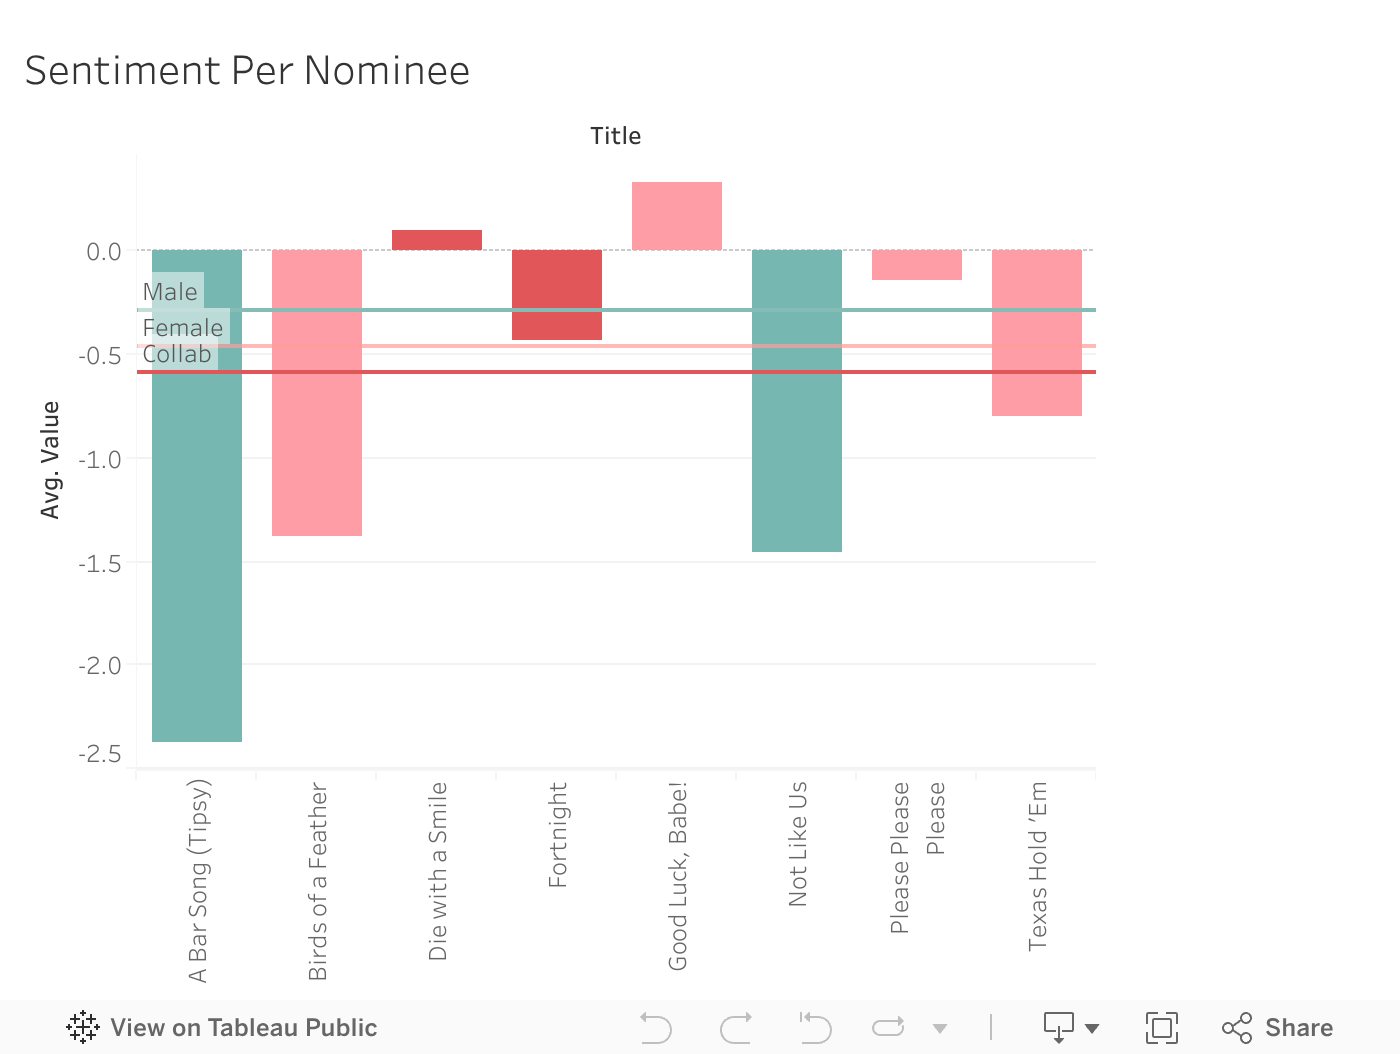
Here, we can see how there is no common sentiment used that scores someone the title of “Grammy Song of the Year.” In the timeline there are is a dip 2006 - 2013 and an arc 2014 - 2019. Other than that, there is no clear pattern or trend leading there to be no prediction of what the sentiment may look like for this upcoming year.
The analysis of Grammy Song of the Year winners from 2000 to 2024 reveals that predicting what will win next is a near-impossible task, as success depends on a blend of factors rather than any single defining characteristic. From audio features like tempo and key to lyrical themes and sentiment, the data shows variability without consistent trends. Sentiment analysis, for instance, highlights emotional diversity across songs, with gendered language reflecting unique perspectives, yet no specific sentiment guarantees a win. These findings emphasize that cultural resonance, industry trends, and intangible qualities likely influence outcomes as much as measurable attributes. Ultimately, the diversity of past winners and nominees underscores the unpredictability of what makes a song iconic, making future victories an exciting and ever-evolving mystery.